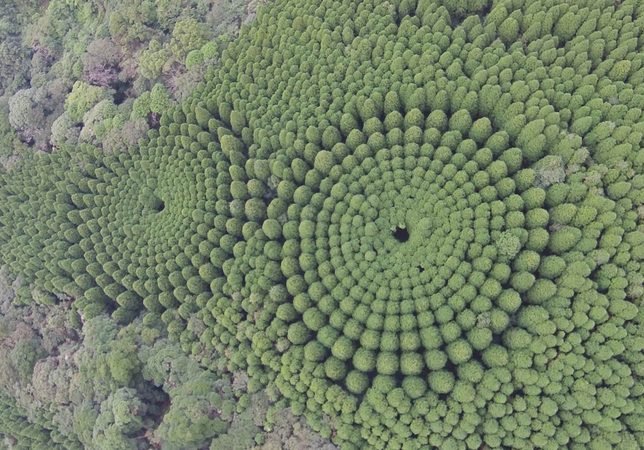
From above, two patches of forest in southern Japan look almost artificial.
Rows of green crowns expand outward in precise circles, forming patterns that have been compared to giant fingerprints, ripples or mysterious crop circles.
But there is no unexplained natural phenomenon behind them.
The trees were deliberately planted as part of a long-term forestry experiment.
Near Nichinan in Miyazaki Prefecture, forestry officials created two circular test plots to answer a practical question: how strongly does planting density affect the growth and quality of sugi, the Japanese cedar?
The experiment began in fiscal year 1973, and the seedlings were planted in March 1974.
Over the next half-century, geometry drawn on paper became something visible from the sky.
THE FOREST WAS DESIGNED AS AN EXPERIMENT
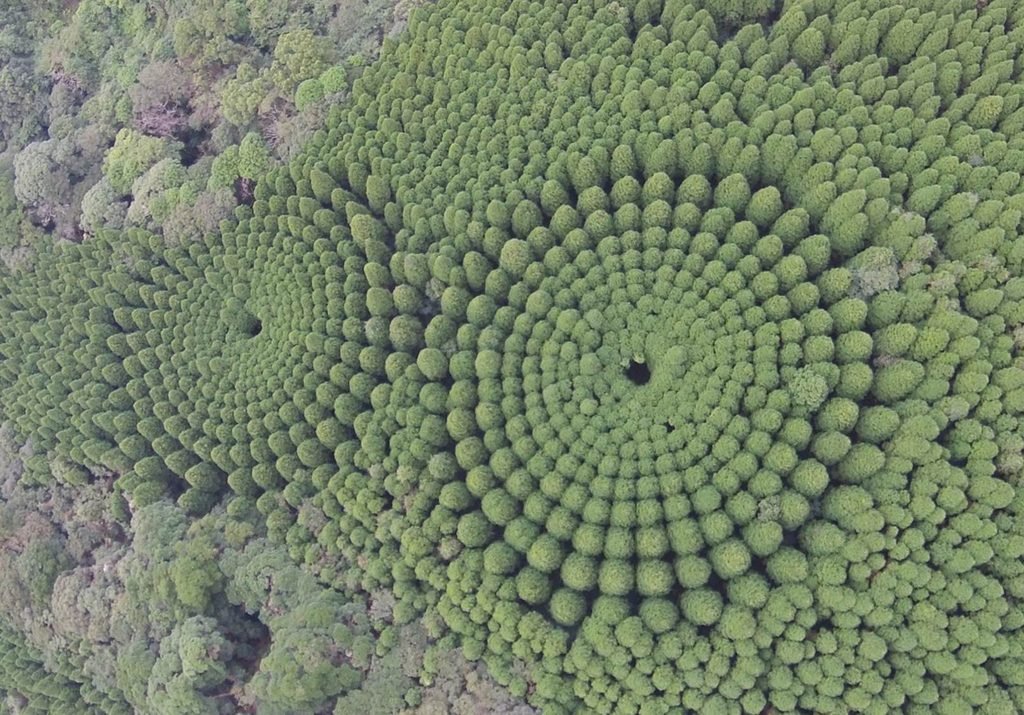
The unusual forest was created in the Ohinata National Forest in Kitago, Nichinan.
The region has a long association with Obi-sugi, a locally important form of sugi, or Cryptomeria japonica.
Historically, forestry in the Obi region often relied on relatively low-density planting. This helped produce timber suited to traditional shipbuilding.
But demand changed during the twentieth century.
As wooden shipbuilding declined and demand for general construction timber increased, forestry managers needed better evidence about whether closer planting could improve timber production.
Instead of establishing many separate rectangular plots, the researchers adopted a systematic spacing design inspired by the work of British statistician John Nelder.
The idea was simple but powerful.
By changing the distance between trees gradually across a small area, many planting densities could be studied under nearly the same slope, soil and climate conditions.
A FOREST BUILT FROM CIRCLES
Two experimental plots were established, each covering approximately 0.225 hectares and measuring about 69 metres across.
The planting layout contained twelve concentric circles.
Thirty-six seedlings were positioned around each ring, aligned along radial lines separated by ten degrees.
That means the original geometric design placed 432 seedlings in each plot, or 864 across the two plots.
However, not all twelve rings were treated as experimental density classes.
The innermost and outermost rings were excluded from the formal density analysis because neighbouring-tree effects were uneven at those boundaries.
That left ten measured density zones.
Across those zones, the original planting density ranged dramatically—from approximately 10,027 trees per hectare in the tightly packed inner sections to only 377 trees per hectare toward the outside.
The experiment effectively compressed a wide range of forest conditions into two compact circles.
That was the scientific purpose of the geometry.
Its extraordinary appearance from the air came later.
COMPETITION BEGAN TO RESHAPE THE CIRCLES
Every tree in the experiment had access to the same basic landscape, but not the same amount of space.
Near the centre, trees grew extremely close together.
Farther outward, each tree occupied progressively more ground.
As the forest matured, competition for light, water, nutrients and growing space began to leave a visible record.
Trees growing at lower densities generally developed larger trunks.
They also tended to become taller than trees crowded into the most densely planted sections.
The result was not simply a two-dimensional pattern of circles.
The forest gradually developed a three-dimensional shape.
The tightly spaced inner trees remained shorter, while more widely spaced trees toward the edges grew taller.
From the side, the canopy began to resemble a shallow bowl or rising wave.
From above, the spacing pattern remained visible as expanding rings of tree crowns.
What people now admire as a piece of landscape art is therefore also a physical record of biological competition.
WHAT 45 YEARS OF GROWTH REVEALED
Measurements taken decades into the experiment demonstrated that planting density affected several important forestry characteristics.
Official survey results from 2018 showed noticeable height differences between the densely planted centres and lower-density outer sections.
In one experimental plot, the difference reached approximately 6.7 metres.
In the second plot, it was approximately 4.4 metres.
Trunk diameter also increased as planting density decreased.
This makes biological sense.
When trees grow close together, they compete intensely with their neighbours. Individual trees have less room to expand their crowns and trunks.
Give each tree more space, and the individual tree can grow larger.
But forestry is not concerned only with the size of a single tree.
Managers must also consider how much total timber a hectare of forest produces.
And that created a more complicated result.
MORE TREES DID NOT ALWAYS MEAN MORE TIMBER
One might assume that the densest plantation would automatically produce the greatest volume of timber per hectare.
The experiment showed that the relationship was not that simple.
Official measurements found that stand volume per hectare was highest around a planting density of 2,339 trees per hectare.
Across a broader range—from approximately 1,626 to 6,987 trees per hectare—total yield remained relatively similar.
At the extreme ends, however, disadvantages appeared.
Very low densities produced large individual trees but fewer of them.
Extremely high densities increased competition and could reduce individual growth and wood quality.
A scientific analysis of the experimental plots published in 2011 concluded that a moderate density of roughly 2,000 to 2,800 trees per hectare represented an effective range for lower-cost forestry under the conditions studied.
The experiment therefore did more than create a striking pattern.
It provided practical evidence for decisions that forest managers make every time they establish a plantation.
WHY TWELVE RINGS SOMETIMES BECOME TEN
Descriptions of the Nichinan forest do not always give the same number of circles.
Some accounts say ten.
Others say twelve.
Both can make sense once the experimental design is understood.
The planting diagram contained twelve physical concentric rings, each with thirty-six planting positions.
But the innermost and outermost rings were not included in the formal density comparison because their exposure to neighbouring trees differed from that of the internal rings.
The actual analysis therefore focused on ten density classes.
This small technical distinction is important because it explains why descriptions of the forest sometimes appear to contradict one another.
The forest itself has twelve designed rings.
The core experiment compared ten density levels.
THE TREES WERE PLANTED IN 1974, NOT RECENTLY
The circular forest periodically goes viral online, where its unusual appearance can make it seem like a recent discovery.
It is not.
The experimental site was established in fiscal year 1973, and planting was carried out in March 1974.
Its planned experimental period extended for fifty years, through fiscal year 2023.
By then, the forest had recorded half a century of competition between trees planted at radically different spacings.
But reaching the end of the original fifty-year period did not mean the forest simply disappeared.
Official forestry activity in 2024 still referred to the circular experimental forest, and the site continued to be used for education and as a local tourism resource.
Its scientific story therefore continues beyond the dates originally written into the experiment.
WHY THE FOREST BECAME FAMOUS
For decades, the experiment was primarily a forestry research site.
Its appearance became much more widely known once aerial and drone photography revealed the geometry from above.
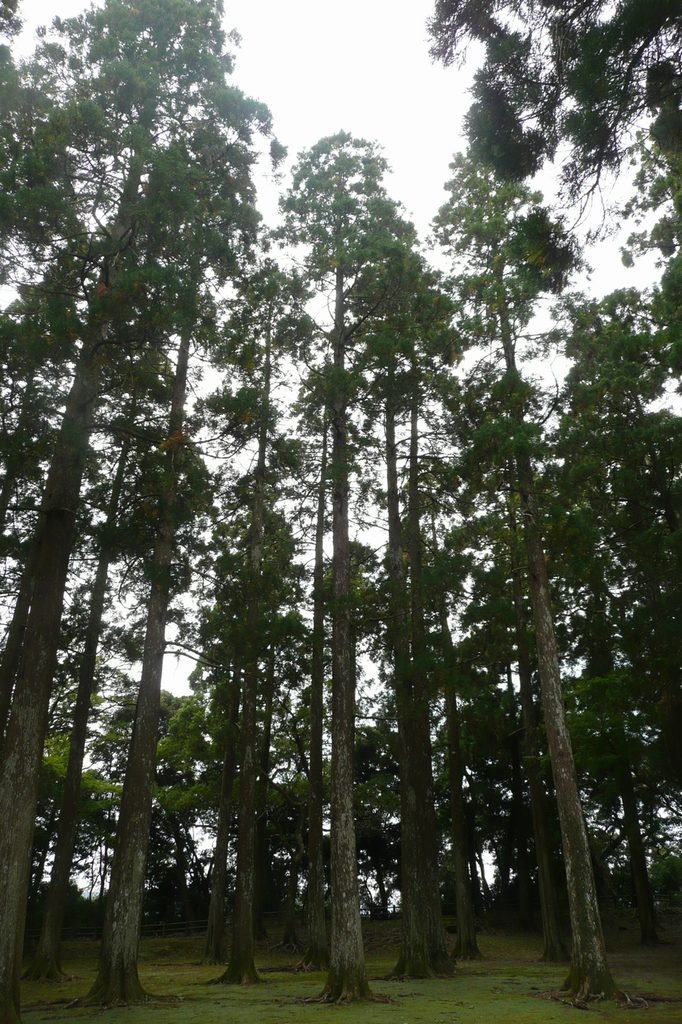
At ground level, visitors mainly see tall sugi trunks stretching upward.
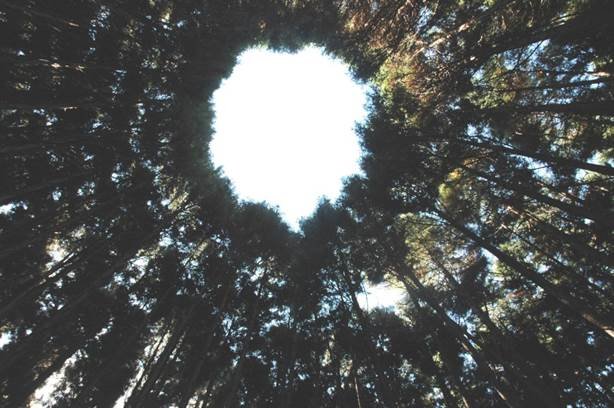
Stand at the centre and the canopy forms an opening toward the sky.
From a drone, however, the original experimental design becomes immediately visible.
The different spacing between each ring produces an extraordinary rhythm of tree crowns.
The visual effect is especially strong because the lower-density outer trees have grown larger than the tightly packed trees near the centre.
The pattern was planned.
Its mature three-dimensional form was not drawn directly by the researchers.
That emerged from decades of growth.
A CONNECTION TO THE HISTORY OF OBI FORESTRY
The experiment also records a moment of economic change.
The Obi region had developed forestry practices suited to timber used in shipbuilding.
When that market weakened, foresters had to reconsider how the same forests could meet growing demand for construction timber.
The circular plots were created partly to provide evidence for that transition.
In this sense, the site is not only a biological experiment.
It is also a record of how a traditional forestry region responded to changing technology and markets.
The trees preserve that history in an unusual way.
Instead of documents stored in an archive, part of the evidence is still standing on a mountainside.
A LIVING GRAPH
The most useful way to understand the Nichinan circles is not as a mystery.
They are a graph made from living trees.
Distance from the centre represents changing planting density.
Tree height, trunk diameter and total timber volume became the results.
Time supplied the final dimension.
Over fifty years, differences that once existed only as numbers in an experimental plan grew into visible changes in the forest itself.
The circles show that giving a tree more space can produce a larger individual tree.
They also show why forest management cannot simply maximize either spacing or density.
Too few trees can reduce total yield.
Too many can intensify competition and affect growth and timber characteristics.
Between those extremes lies the balance that the experiment was designed to investigate.
The geometry was created by people.
The final form was created by biology.
More than half a century after the first seedlings were planted, the circular forest of Nichinan remains an unusual example of science performed on the scale of a landscape.
What began as a practical forestry trial became something its designers could eventually read from both the ground and the sky:
a fifty-year record of competition, growth and time written in trees.
——————————————————————————————————————————————————————————————————————
1. Kyushu Regional Forest Office — Miyazaki Southern Forest Management Office
Forest Stand Density Experimental Forest (“Mystery Circle”)
Official Forestry Agency page explaining the purpose, location, experimental design, planting densities and 50-year study period of the Nichinan circular sugi plots. Rinya
Official Kyushu Regional Forest Office page
2. Kyushu Regional Forest Office — Forest Stand Density Trial Technical Report
林分密度試験林 (Forest Stand Density Experimental Forest)
Official technical document confirming planting in March 1974, two 0.225-hectare plots, the 69-metre diameter design, 12 physical rings with the innermost and outermost excluded from analysis, and planting densities from 10,027 to 377 trees per hectare. Rinya
Official technical PDF
3. Fukuchi, S., Yoshida, S., Mizoue, N. et al. (2011)
Analysis of the Planting Density toward Low-cost Forestry: A Result from the Experimental Plots of Obi-sugi Planting Density.
Journal of the Japanese Forest Society, Vol. 93, Issue 6, pp. 303–308.
DOI: 10.4005/jjfs.93.303
The study analyzed the Nichinan plots and concluded that roughly 2,000–2,800 trees per hectare represented an appropriate moderate planting density for low-cost forestry under the conditions examined. J-STAGE
J-STAGE scientific paper
4. Kyushu Regional Forest Office (2024)
Field Visit to the Forest Stand Density Experimental Forest (“Mystery Circle”)
An official 2024 report confirms that the experimental forest remained in place after the original 50-year study period and was being used for forestry education and as a tourism resource. Rinya
Official 2024 Forestry Agency report